
12.1 Summary Table
The Summary Table is a multi-dimensional financial report that aggregates all costs and revenues in a project by configurable groupings and time periods. It provides a spreadsheet-like view with total columns and periodic breakdowns - making it ideal for financial reporting, budget review meetings, and variance analysis.
To access the Summary Table, open a project from the Projects panel and click the Summary Table tab in the top menu.
Table structure
The Summary Table has two main column areas:
|
Area |
Description |
|---|---|
|
Total |
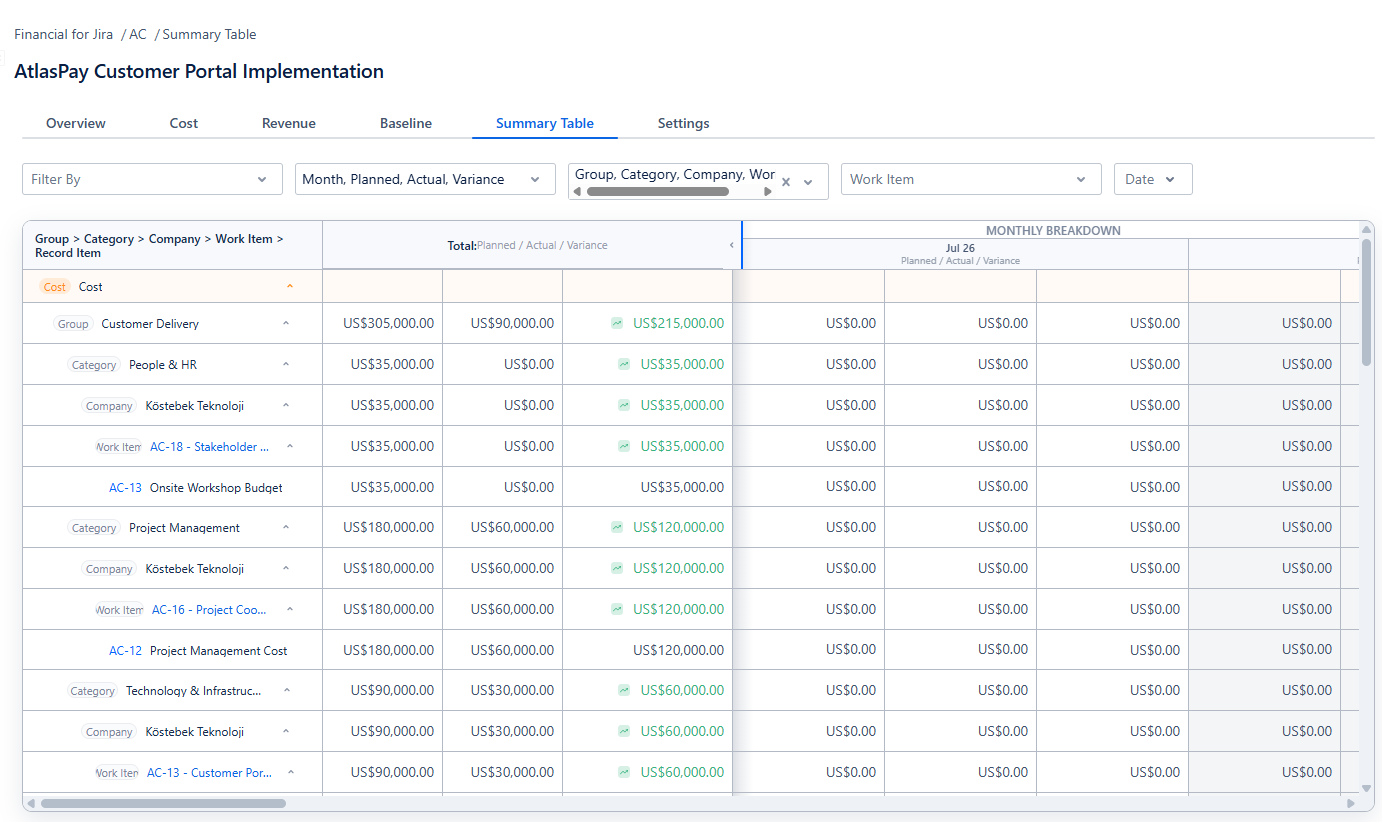
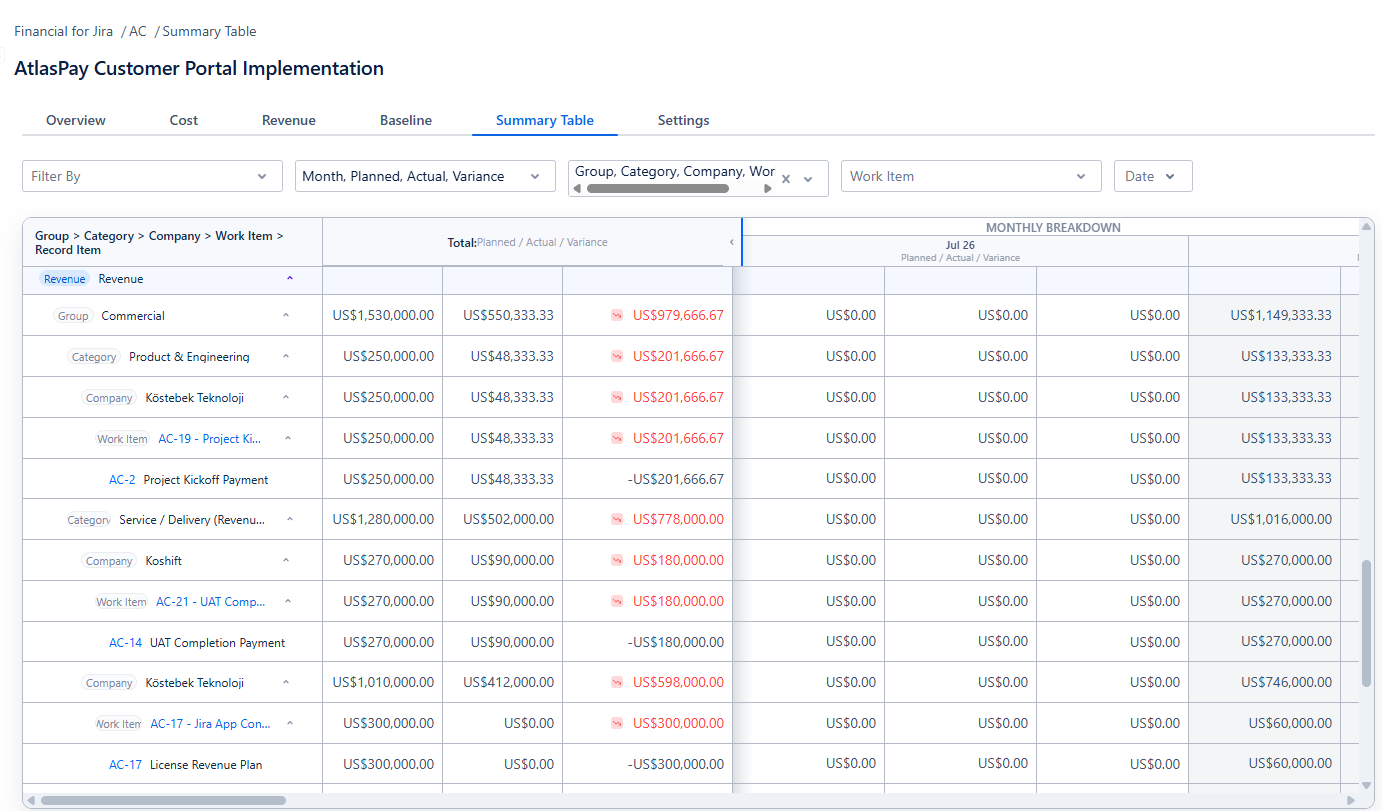
Shows the overall Planned, Actual, and Variance amounts across the entire date range. |
|
Periodic Breakdown |
Shows the Planned, Actual, and Variance amounts broken down by the selected time period (e.g., monthly columns like "Jul 26", "Aug 26"). |
12.2 Row hierarchy
The left side of the table displays a collapsible hierarchy based on your selected groupings. The default hierarchy reads:
Group > Category > Company > Work Item > Record Item
Each level aggregates the financial data of its children. Expand any row using the arrow to see its breakdown.
12.3 Variance column
The Variance column shows the difference between Planned and Actual:
|
Indicator |
Meaning |
|---|---|
|
🟢 Green value with ↗ arrow |
Under budget for costs, or above target for revenue. |
|
🔴 Red value with ↘ arrow |
Over budget for costs, or below target for revenue. |
|
Black value (no icon) |
No plan exists for comparison, or the variance is exactly zero. |
12.4 Toolbar controls
The Summary Table toolbar lets you tailor the report to the result you need. Use the available controls to filter and organise the data:
-
Filter By: Narrow records by Label, Category, Company, Group, or Status.
-
Time Period & Columns: Choose Day, Week, Month, Quarter, or Year, and show Planned, Actual, and/or Variance.
-
Group By: Organise rows by Group, Category, Company, or Work Item.
-
Work Item: Show records linked to selected Jira work items.
-
Date: Limit results to a selected date range.
Select the options you need, then click Apply & Search. Use Clear all to reset the filters.
12.5 Reading the Summary Table
Example interpretation:
A row showing:
Cost: Group: Customer Delivery → Category: People & HR → Company: Köstebek Teknoloji → Work Item: AC-18 - Stakeholder Workshop → Record: AC-13 Onsite Workshop Budget
Values: Planned US$35,000.00 | Actual US$0.00 | Variance 🟢 US$35,000.00
This means the AC-13 cost record has a planned amount of US$35,000.00 and no actual costs recorded. The positive variance is shown in green with an upward arrow, indicating that the cost is currently under budget.
Revenue: Group: Commercial → Category: Product & Engineering → Company: Köstebek Teknoloji → Work Item: AC-19 - Project Kickoff → Record: AC-2 Project Kickoff Payment
Values: Planned US$250,000.00 | Actual US$48,333.33 | Variance 🔴 -US$201,666.67
This means the AC-2 revenue record has US$48,333.33 recorded against a planned US$250,000.00. The negative variance is shown in red with a downward arrow, indicating that revenue is below target. The monthly breakdown also shows US$133,333.33 in a later period, while the other visible monthly values are US$0.00.
Unassigned rows:
Records without an assigned Group, Category, Company, or Work Item are aggregated under "Unassigned Group", "Unassigned Category", "Unassigned Company", or their respective unassigned labels.