
Financials for Jira provides analytical tools to track your project's financial position over time. One such tool is the Baseline tab for snapshot-based comparisons.
The Baseline tab is accessible from the top menu in any project.
11.1 Baseline
Definition: A Baseline is a saved snapshot of a project's planned costs and revenues at a specific point in time. Create baselines at key moments - such as the start of a quarter, before a scope change, or at a milestone - to track how financial plans evolve and to compare plan versions with each other and with actuals.
To access the Baseline tab, open a project from the Projects panel and click the Baseline tab in the top menu.
11.2 Baseline List
The Baseline List displays all saved baselines for the current project.
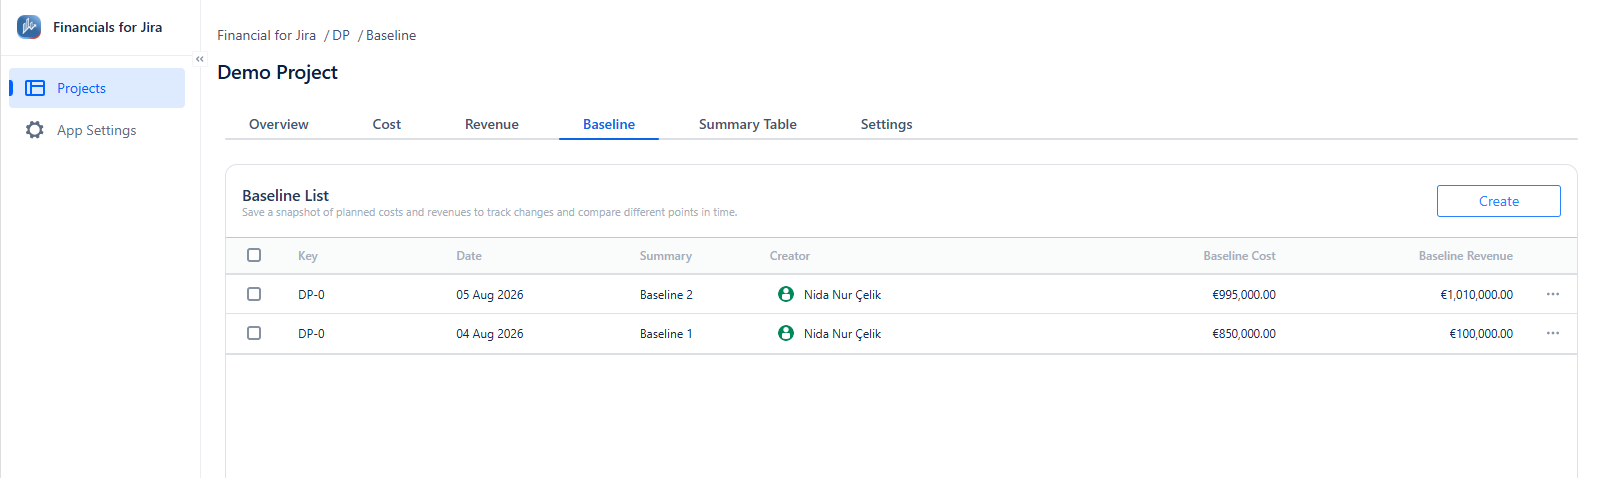
|
Baseline Cost |
The total planned cost at the time the baseline was saved. |
|
Baseline Revenue |
The total planned revenue at the time the baseline was saved. |
11.3 Creating a baseline
-
Click the Create button in the top-right corner of the Baseline List.
-
Enter a Summary - a descriptive name for this baseline (e.g., "Initial Budget", "Post-Scope Change").
-
Click Add.
The system captures the current state of all planned costs and revenues in the project and saves them as a frozen snapshot.
Create a baseline before making significant changes to your plans. This gives you a reference point to compare against later. For example, create a baseline at the start of each quarter to track how your budget evolves over the quarter.
11.4 Editing and deleting a baseline
Click the three-dot menu (⋯) next to any baseline in the list to access:
|
Action |
Description |
|---|---|
|
Edit Baseline |
Change the summary name of the baseline. |
|
Delete Baseline |
Permanently remove the baseline snapshot. |
11.5 Comparing baselines
Select two or more baselines by checking the checkboxes on the left side of each row. When at least two baselines are selected, a Compare button appears in the top-right corner. Click Compare to open the comparison view.
11.6 Cumulative Chart Compared to Baseline
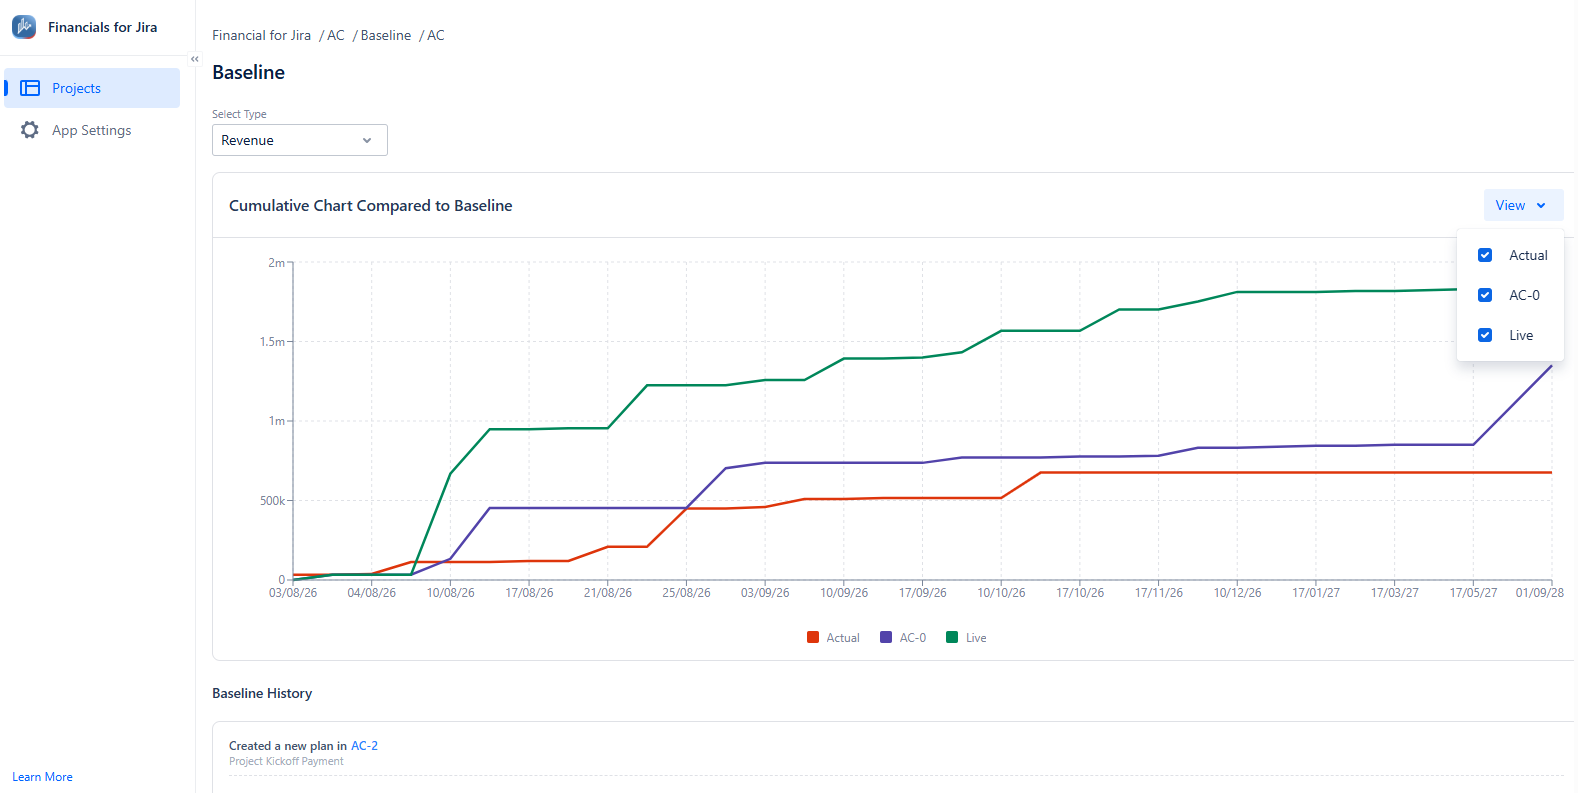
The comparison view displays a Cumulative Chart Compared to Baseline - a line chart that plots the cumulative financial data over time, with a separate line for each selected baseline and optional additional reference lines.
Chart controls:
|
Control |
Description |
|---|---|
|
Select Type |
Switch between Revenue and Cost to view the corresponding data. |
|
View |
A dropdown with checkboxes to toggle individual lines on or off in the chart. |
Chart lines:
|
Line |
Description |
|---|---|
|
Baseline lines (named by key) |
Each selected baseline is shown as a separate line, representing the cumulative planned values as they were at the time that baseline was saved. |
|
Live |
The current cumulative planned values (the live state of the project's plans as of today). |
|
Actual |
The cumulative actual values recorded over time. |
Use the View dropdown to hide or show individual lines. This is useful when comparing many baselines - you can toggle off older baselines to focus on the ones most relevant to your analysis.
How to interpret the chart:
-
If the Live line is above a baseline line, your current plans are larger than the plans at the time of that baseline - meaning scope or budget has increased.
-
If the Actual line is below the Live line, your realised costs or revenues are behind the current plan.
-
Comparing two baseline lines shows how your planned figures changed between those two points in time.
11.7 Baseline History
Below the chart, the Baseline History section shows a log of changes that have occurred since the baselines were created. Each entry describes what changed, along with the baseline values at the time of each compared baseline.
This gives you a record-level audit trail of how plans were modified between baseline snapshots.