
The Cost and Revenue tabs are where you view, manage, and drill into all financial records within a project. Both tabs share the same layout and interaction patterns - the only difference is the type of financial data they display.
To access these views, open a project from the Projects panel and click the Cost or Revenue tab in the top menu.
9.1 List view
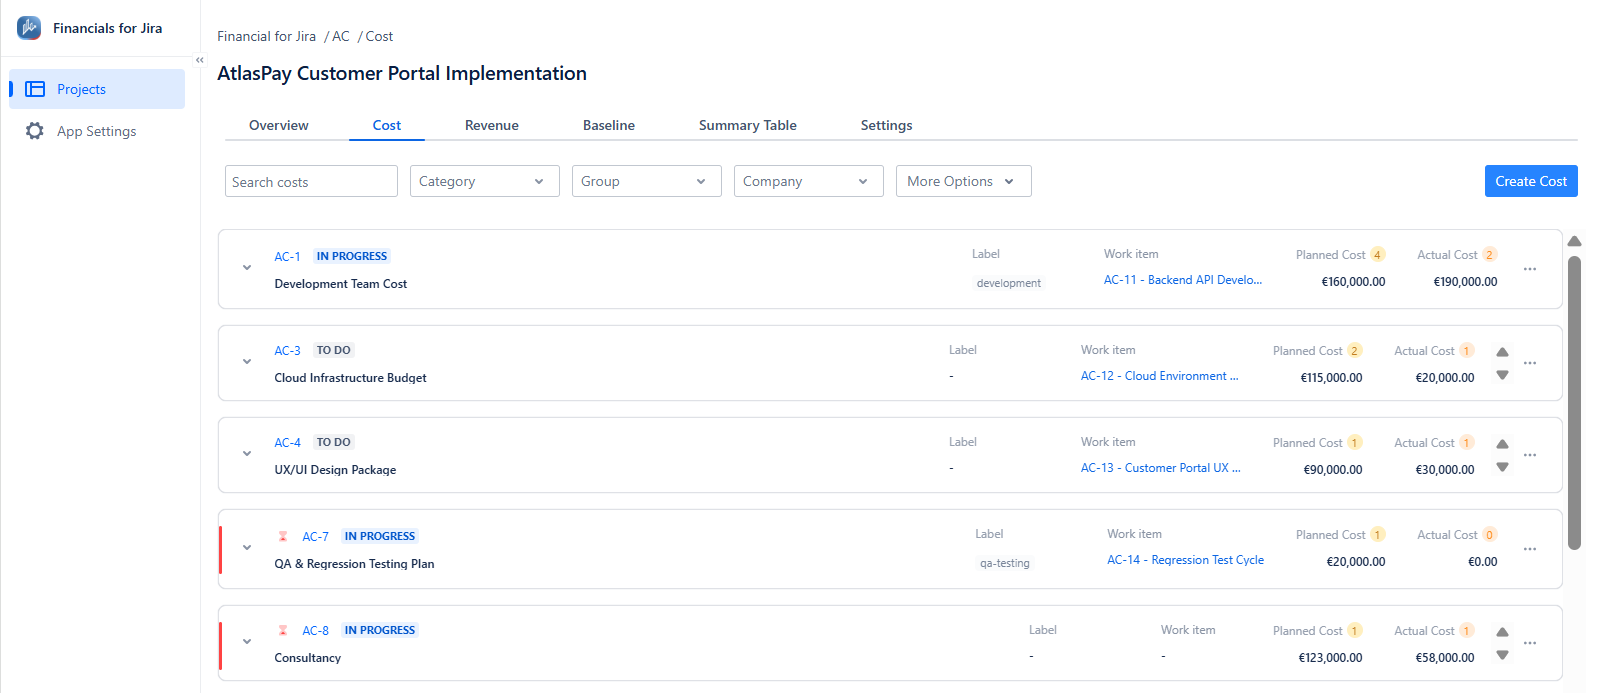
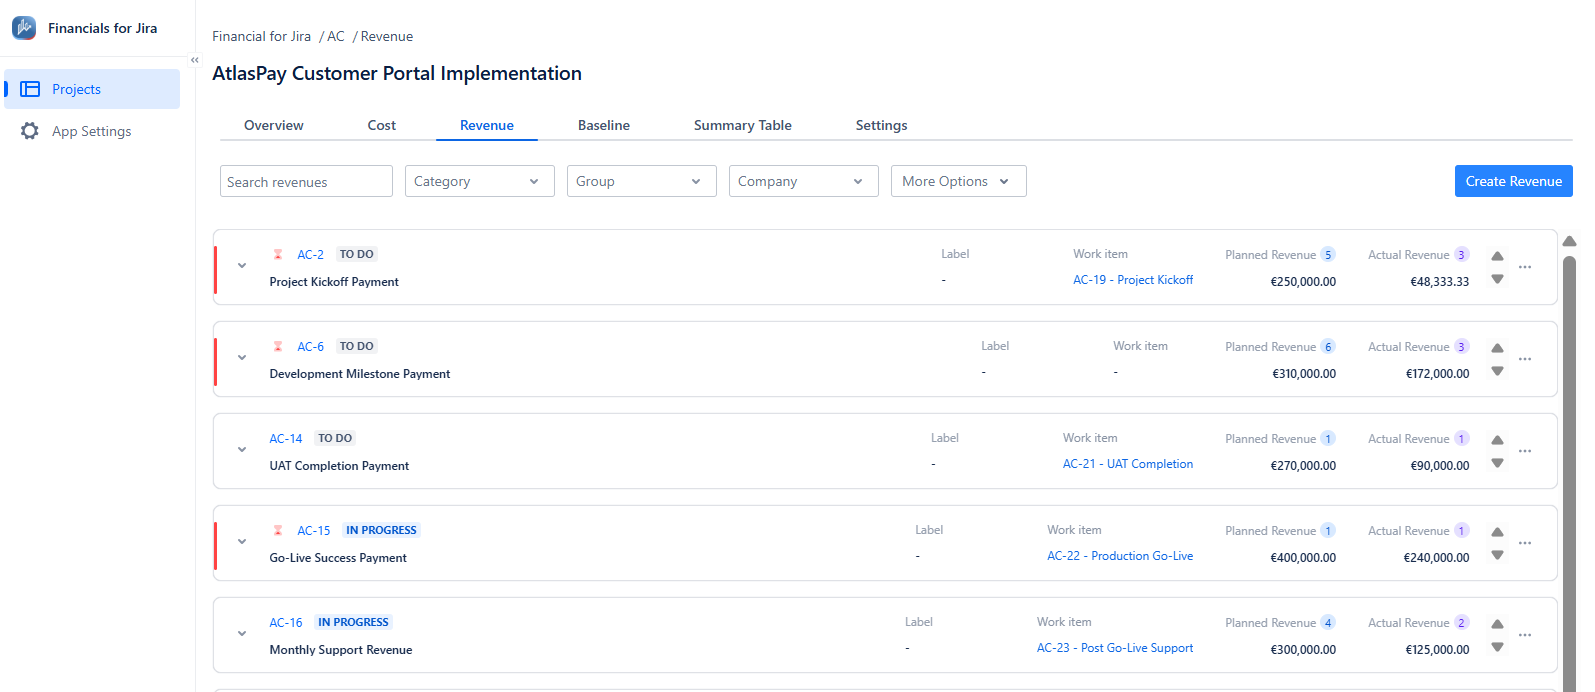
When you open the Cost or Revenue tab, you see a list of all project records. Each row shows a single revenue or cost entry and displays the key, status, summary, label, work item, planned cost/planned revenue and actual cost/actual revenue.
9.2 Searching and filtering
The toolbar above the list provides options to narrow down the records displayed:
|
Control |
Description |
|---|---|
|
Search costs / Search revenues |
Free-text search field. Filters records by summary, key, or other text fields. |
|
Category |
Filter by the assigned category. |
|
Group |
Filter by the assigned group. |
|
Company |
Filter by the assigned company. |
|
More Options |
Additional filter options (e.g., status, label, date ranges). |
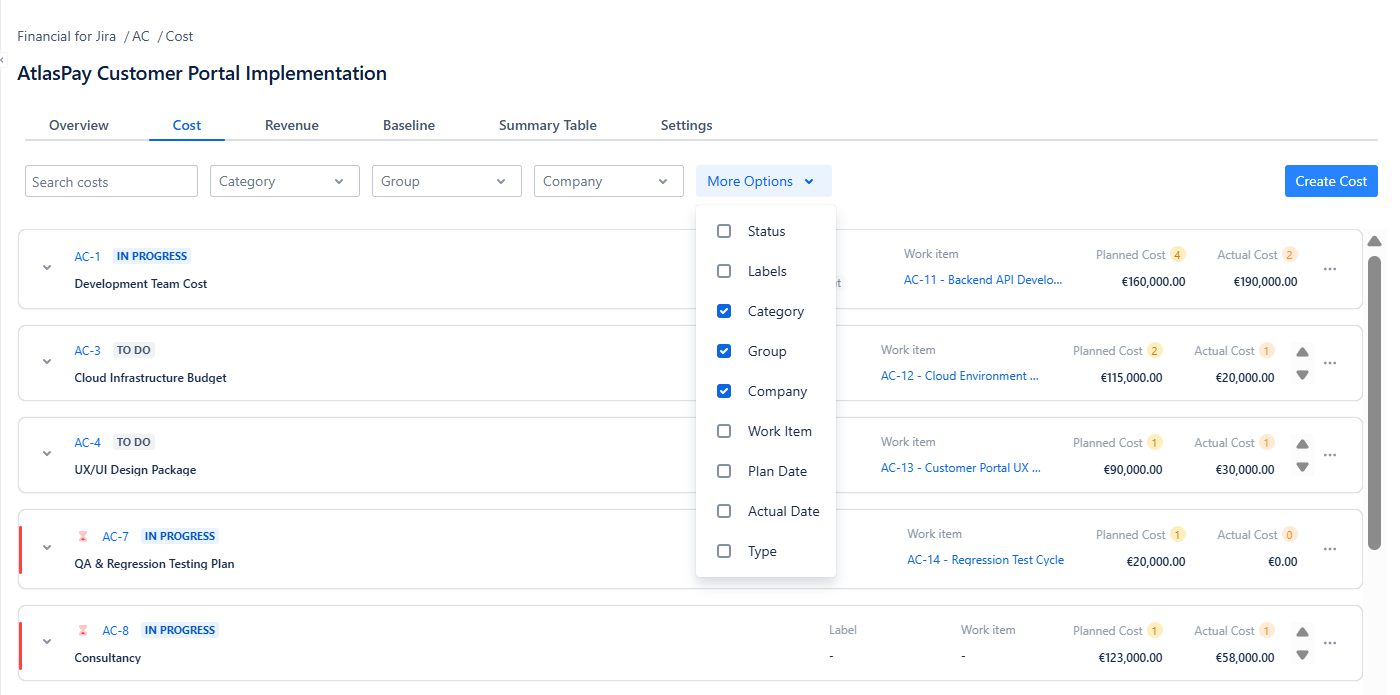
Use filters in combination to quickly locate specific records - for example, filtering by Category "Technology & Infrastructure" and Company "Vendor X" to see all infrastructure costs associated with a specific vendor.
9.3 Three-level hierarchy
The Cost and Revenue tabs use a collapsible three-level hierarchy. Each level reveals more detail:
Level 1: Record (collapsed by default)
This is the top-level row visible in the list. It shows the record's key, status, summary, and aggregated totals.
Level 2: Plans
Click the expand arrow (▼) next to the record key to reveal the plan list. This level shows:
-
A detail row displaying the record's Category, Group, Company, and Description fields.
-
A "Planned Costs" or "Planned Revenues" section listing each individual plan entry with its date, planned amount, and actual amount.
|
Column |
Description |
|---|---|
|
Type badge |
"Planned" indicates this is a plan entry. |
|
Date |
The date this plan is scheduled for. |
|
Planned Cost / Planned Revenue |
The planned amount for this specific entry. |
|
Actual Cost / Actual Revenue |
The total actual amount recorded against this specific plan. The number badge shows how many actuals are linked to this plan. |
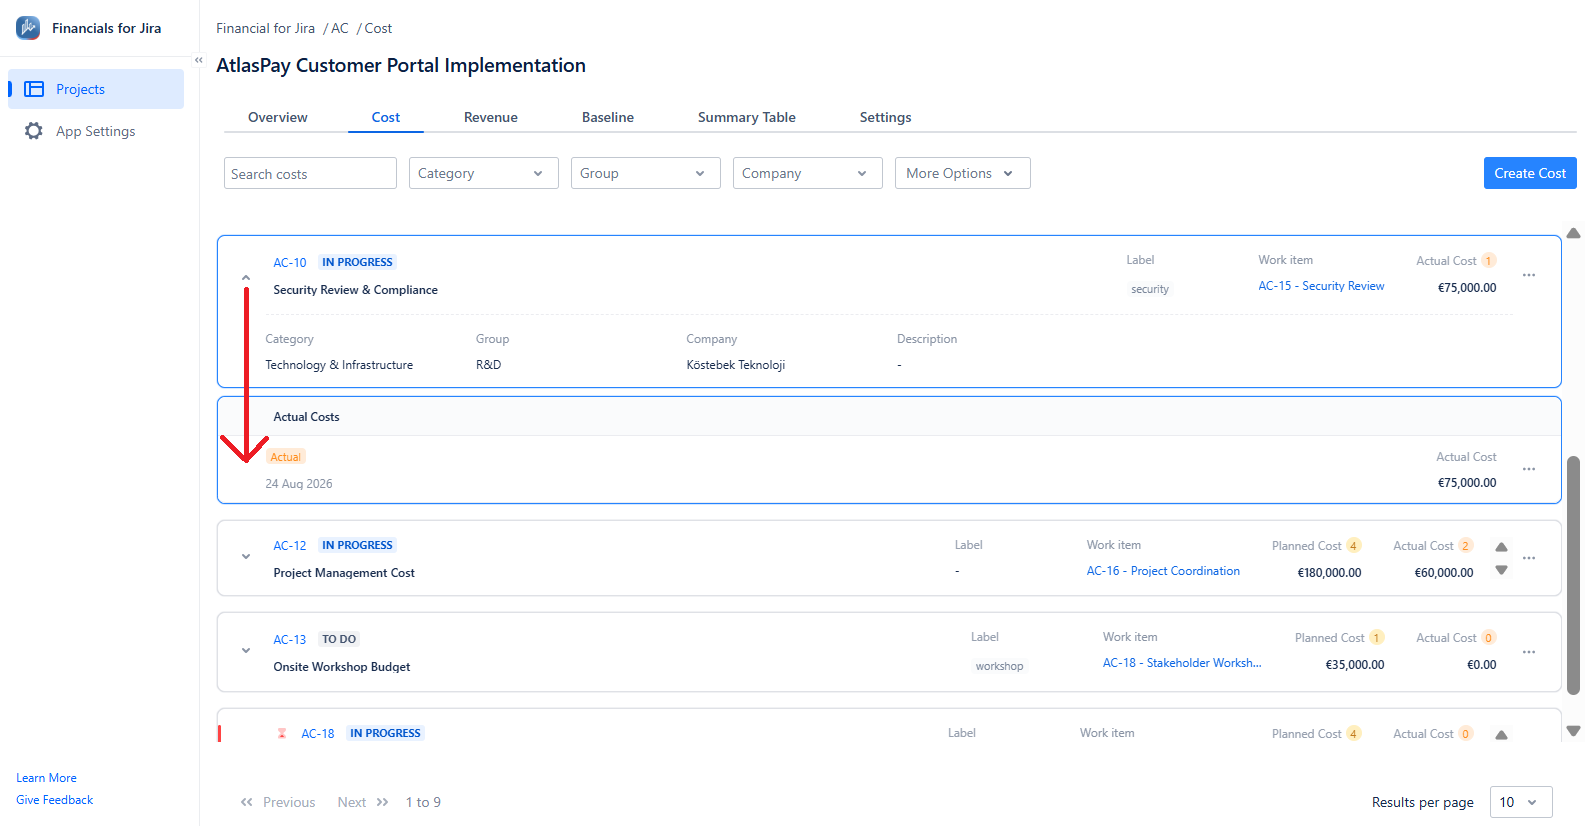
Level 3: Actuals
Click the expand arrow (▼) next to a plan entry to reveal the actuals recorded against that plan. Each actual row shows:
|
Column |
Description |
|---|---|
|
Type badge |
"Actual" indicates this is an actual entry. |
|
Date |
The date the actual occurred. |
|
Actual Cost / Actual Revenue |
The amount of this individual actual. |
The hierarchy works like a drill-down: Record → Plans → Actuals. At each level, you can see how the totals at the parent level are composed from the child entries below.
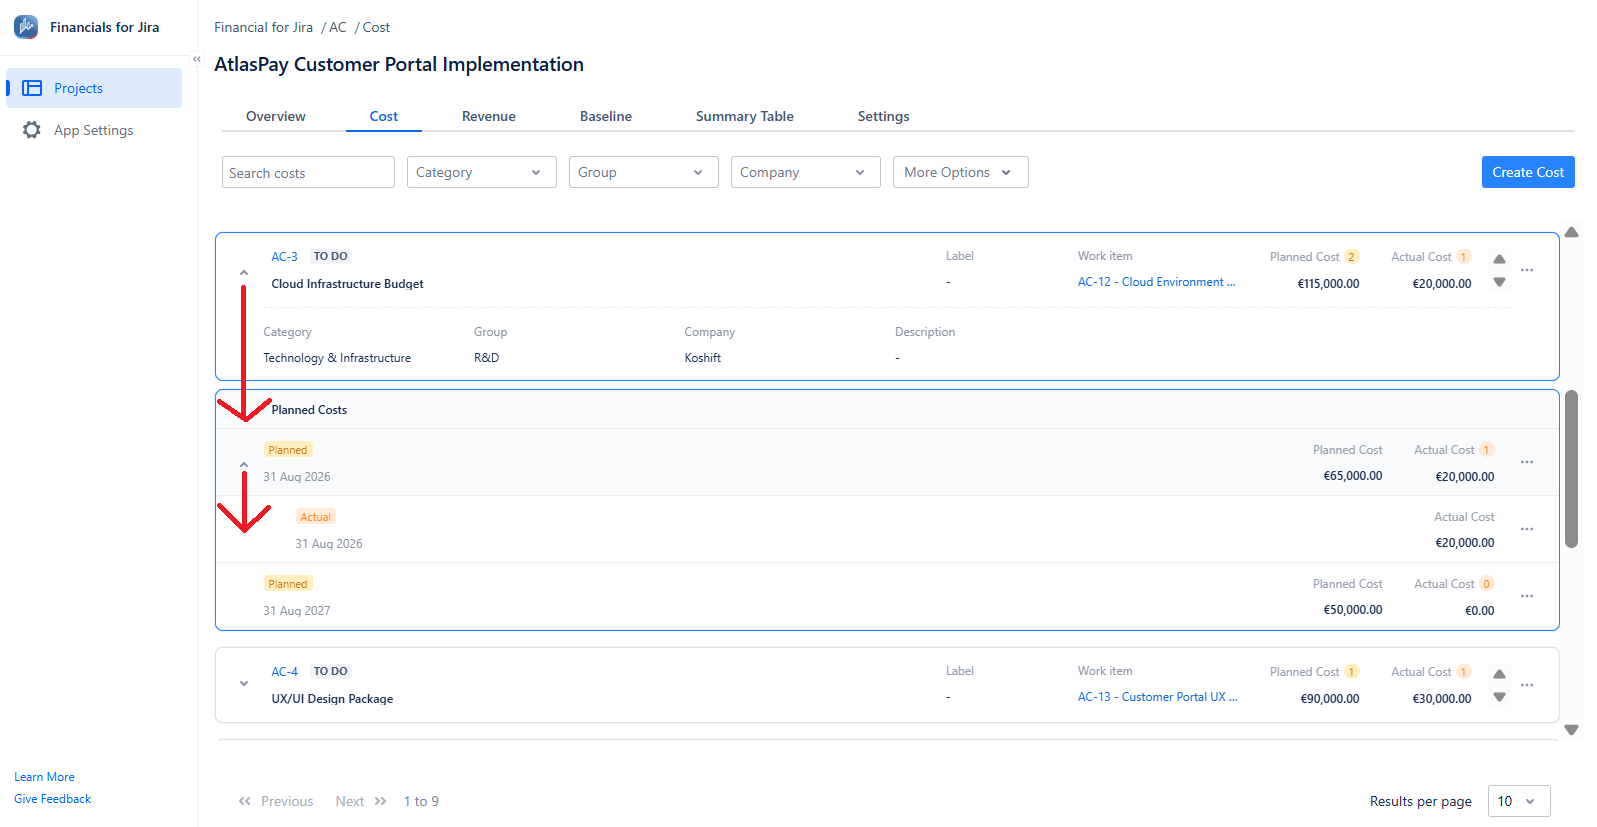
Records entered as actual cost or revenue use a two-level hierarchy because they lack an associated plan.
9.4 Reading the data
Comparing planned vs. actual at a glance
Each row - whether at record level or plan level - shows both the planned and actual amounts side by side. This lets you quickly identify:
-
Fully realized plans - Actual equals Planned (e.g., Planned Cost €200,000.00 / Actual Cost €200,000.00).
-
Partially realized plans - Actual is less than Planned (e.g., Planned Revenue €30,000.00 / Actual Revenue €15,000.00).
-
Plans with no actuals - Actual shows €0.00 with a badge of 0.
9.5 Actions
Each row at every level has a three-dot menu (⋯) on the right side. The available actions depend on the level:
|
Level |
Available actions |
|---|---|
|
Record |
Add Plan, Update Revenue/Cost, Delete Revenue/Cost |
|
Plan |
Add Actual, Update Plan, Delete Plan |
|
Actual |
Update Actual, Delete Actual |
If an actual item is added to the plan, the "Delete plan" option does not appear on the screen.